Install logstash with the steps below or just use this guide in case it won’t let you to install via apt.
sudo apt-get update && sudo apt-get install logstashCreate your syslog.conf file.
input {
  tcp {
    port => 5000
    type => syslog
  }
  udp {
    port => 5000
    type => syslog
  }
}

filter {
  if [type] == "syslog" {
    grok {
      match => { "message" => "%{SYSLOGTIMESTAMP:syslog_timestamp} %{SYSLOGHOST:syslog_hostname} %{DATA:syslog_program}(?:\[%{POSINT:syslog_pid}\])?: %{GREEDYDATA:syslog_message}" }
      add_field => [ "received_at", "%{@timestamp}" ]
      add_field => [ "received_from", "%{host}" ]
    }
    date {
      match => [ "syslog_timestamp", "MMM  d HH:mm:ss", "MMM dd HH:mm:ss" ]
    }
  }
}

output {
  elasticsearch {
	hosts => ["localhost:9200"]
	user => "elastic"
 	password => "password88123818"
        index => "syslog-%{+YYYY.MM.dd}"
  }
  stdout { codec => rubydebug }
}
We got the config codes below from this example configuration. We are using port 5000 to ingest/input logs to logstash, we connect to our elasticsearch port 9200 and login details for our elastic search.
Start logstash binary using that syslog config file.
root@ubuntu18:/etc/logstash# /usr/share/logstash/bin/logstash -f syslog.conf
Using bundled JDK: /usr/share/logstash/jdk
OpenJDK 64-Bit Server VM warning: Option UseConcMarkSweepGC was deprecated in version 9.0 and will likely be removed in a future release.

[INFO ] 2021-07-17 14:48:21.774 [[main]<tcp] tcp - Starting tcp input listener {:address=>"0.0.0.0:5000", :ssl_enable=>false}
[INFO ] 2021-07-17 14:48:22.134 [Agent thread] agent - Pipelines running {:count=>1, :running_pipelines=>[:main], :non_running_pipelines=>[]}
[INFO ] 2021-07-17 14:48:22.139 [[main]<udp] udp - Starting UDP listener {:address=>"0.0.0.0:5000"}
[INFO ] 2021-07-17 14:48:22.383 [[main]<udp] udp - UDP listener started {:address=>"0.0.0.0:5000", :receive_buffer_bytes=>"106496", :queue_size=>"2000"}
To run your syslog.conf automatically, you can save it inside the conf.d folder.
/etc/logstash/conf.d
root@ubuntu18:/etc/logstash/conf.d# ls
syslog.conf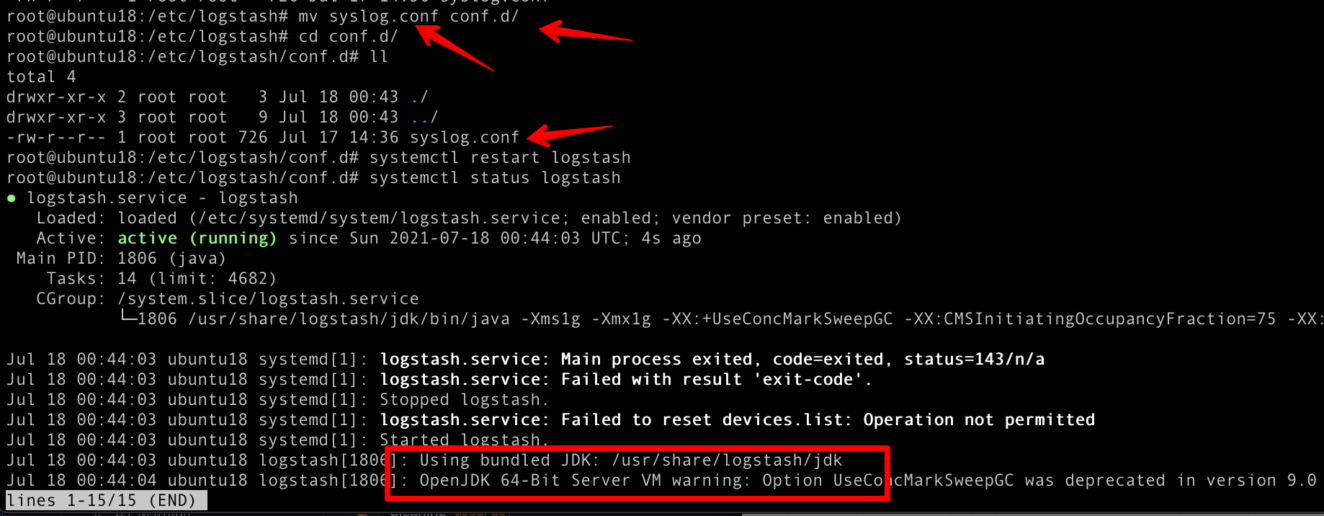
Forwarding Syslog Messages to Logstash via TCP Connections
Insert the codes below to /etc/rsyslog.d/50-default.conf
*.* @@127.0.0.1:5000Then restart rsyslog.service
sudo systemctl restart rsyslog.serviceSetup Kibana Index pattern for our syslog events
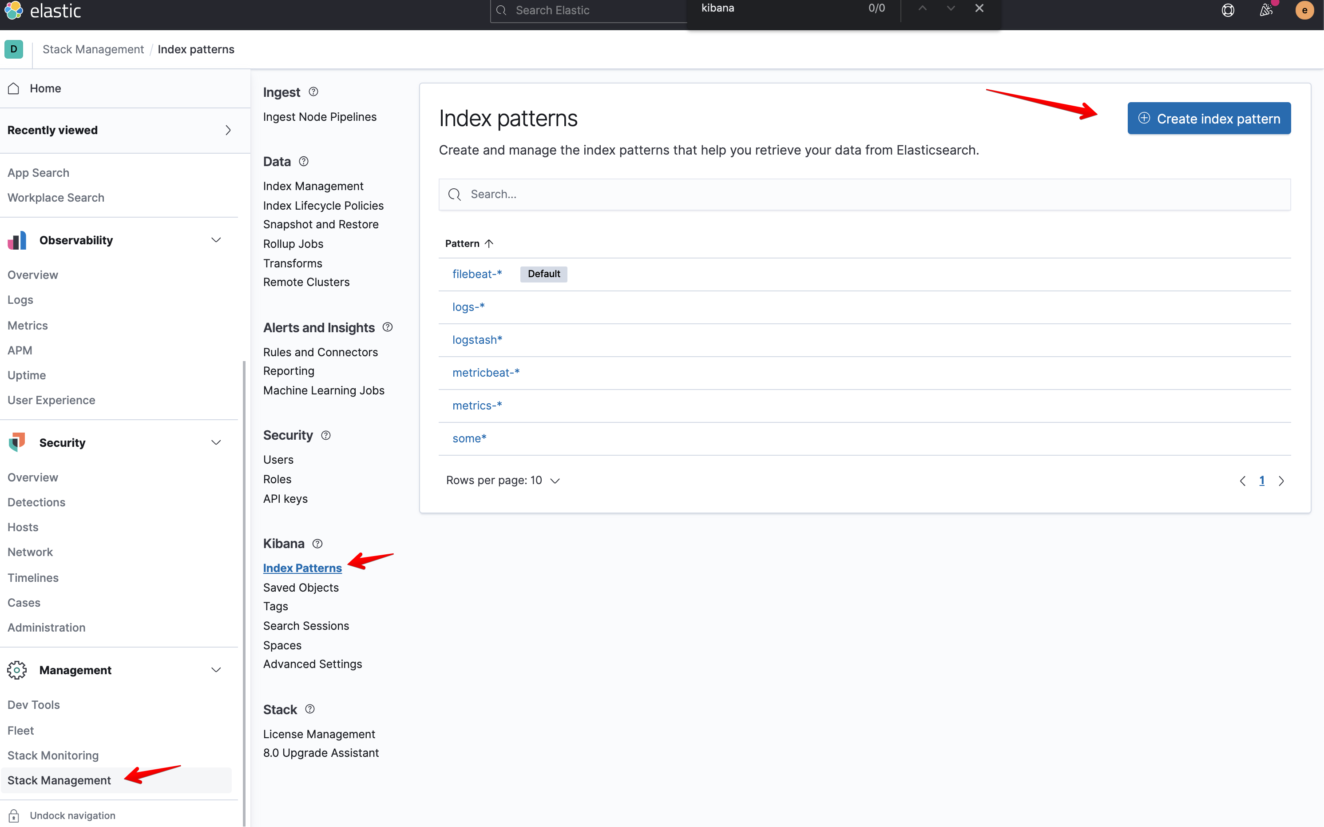
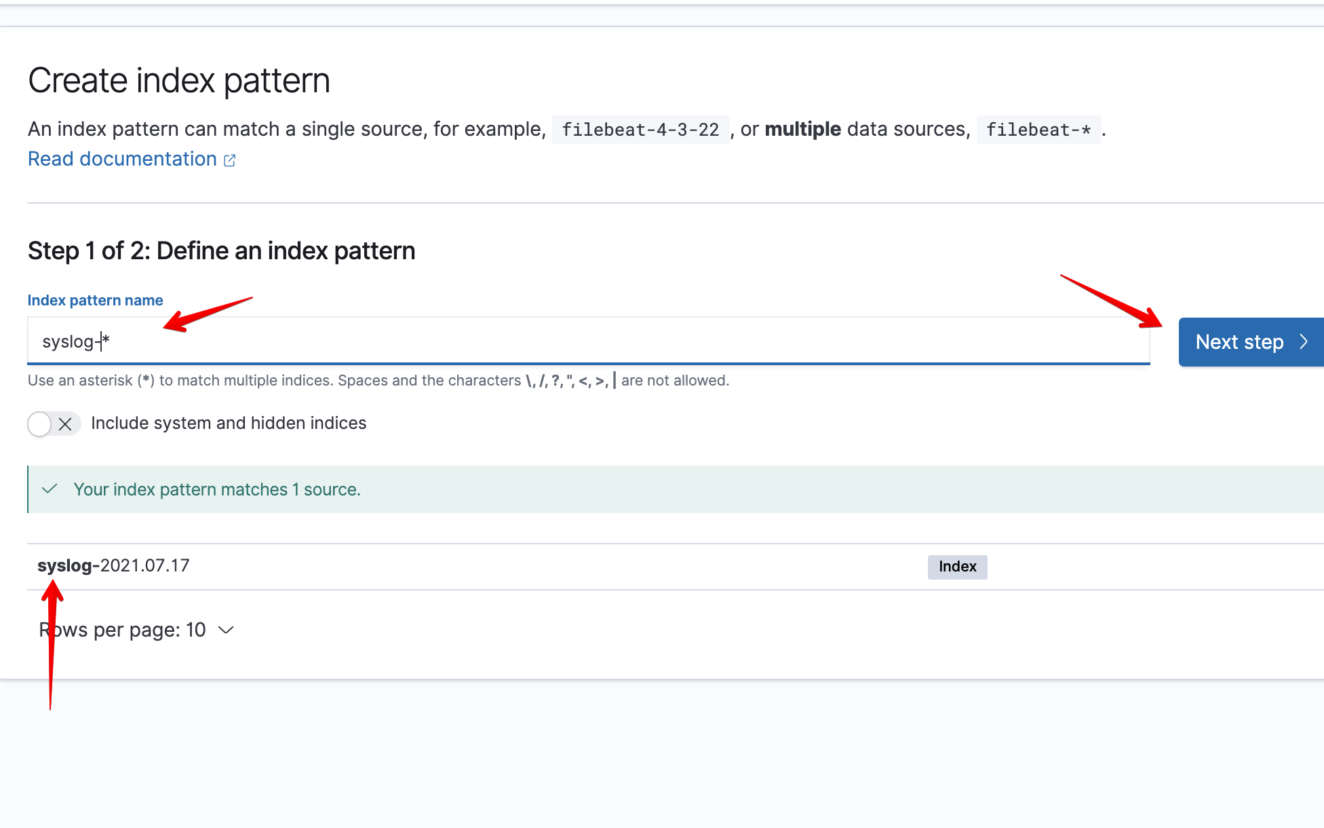
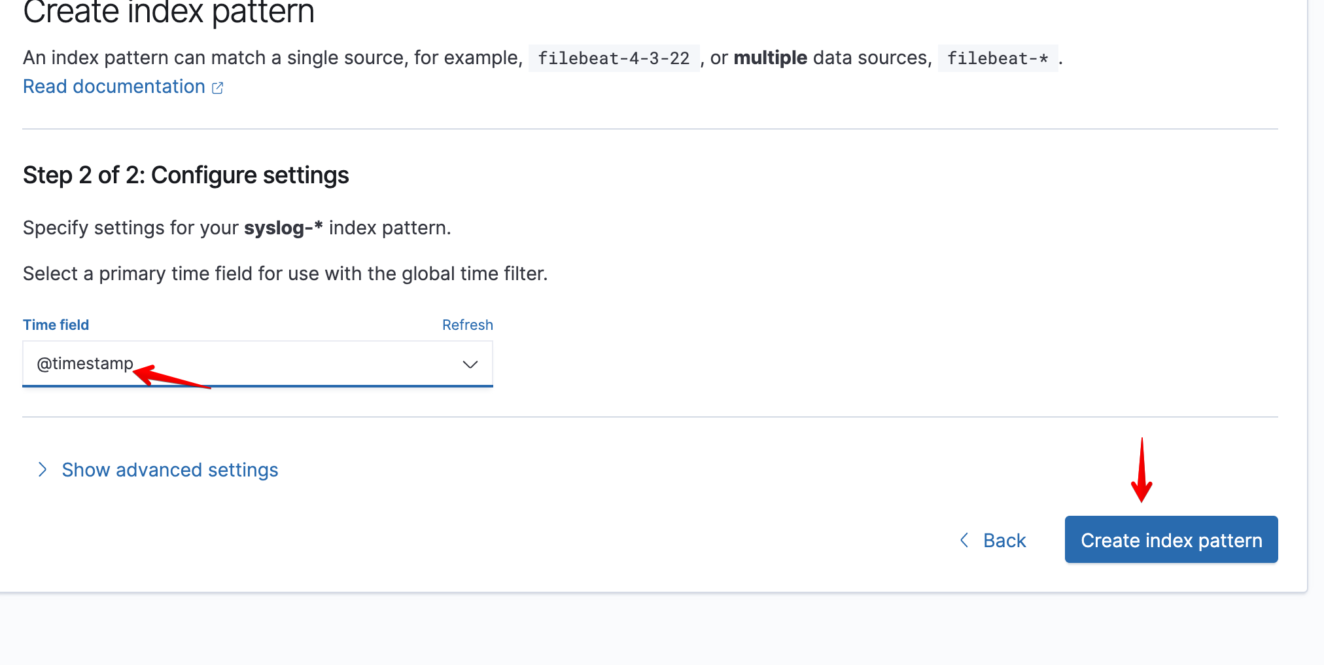
Let’s test it!
Stop a service like nginx then look for that event syslog then go to Kibana -> Discover and find that event.
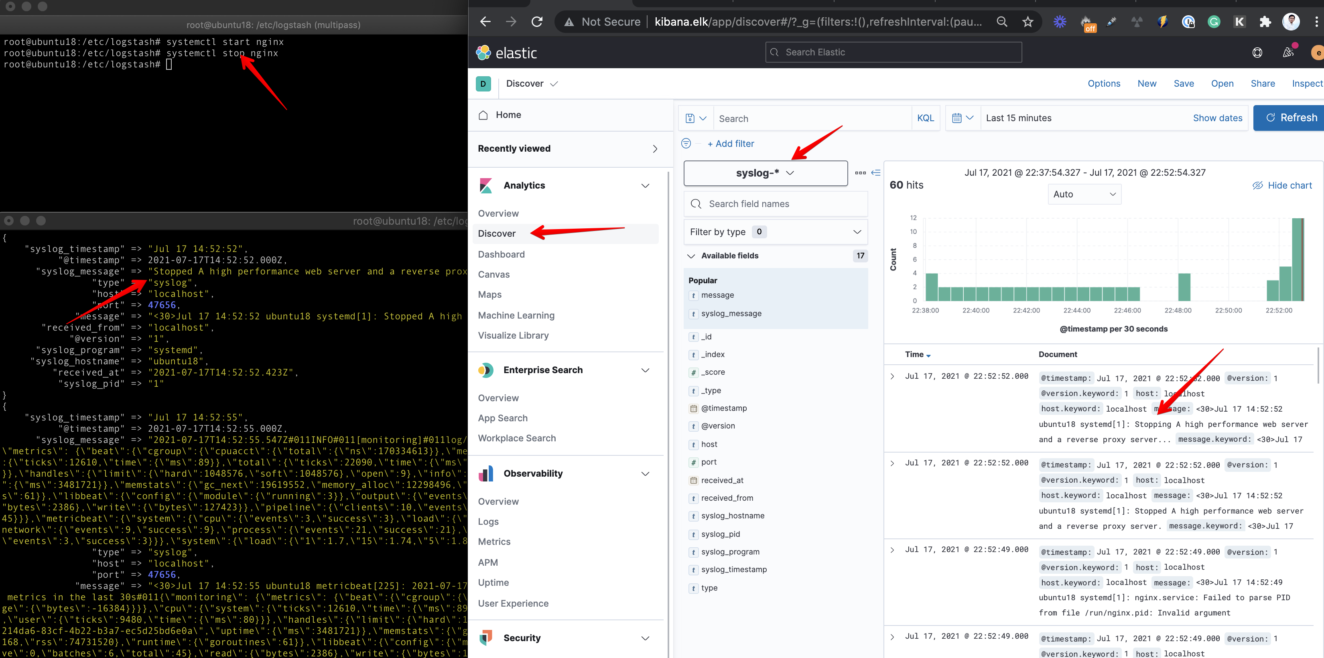
So now we were able to set up the Logstash Syslog event ingestion where rsyslog service is forwarding the log data to our Logstash service.